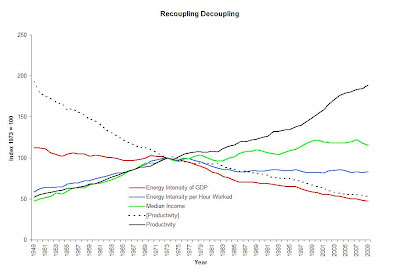
The Sandwichman is concerned with another kind of decoupling -- the much touted decoupling of energy consumption from GDP growth that technological optimists like Amory Lovins promote as the solution to environmental impact and resource exhaustion problems. Relative decoupling of energy consumption per dollar of GDP is a well established fact. What is in dispute is whether that can be translated into absolute decoupling through imminent technological breakthroughs.
The short answer is: it can't. The slightly longer answer is it can't because even the relative decoupling that has occurred over the last 39 years is questionable. Oh, there's no doubt that energy consumption per dollar of GDP has fallen; what's questionable is the composition and distribution of that growing GDP.
Even at the aggregate level, there is the question of the increasing proportion of economic activity that needs to be devoted to repairing the damage done by previous economic activity -- cleaning up toxic spills, recovering from extreme weather events, etc. This is what Stefano Bartolini referred to as negative externalities growth and Roefie Hueting called asymmetric entering. This is a kind of decoupling of GDP increase from any meaningful notion of expanded or improved utility. It is just running faster on a treadmill.
But that's not all. There is also the question of distribution and even the possibility that the growing gap between GDP growth and median incomes is a structural imperative. Now, by "structural imperative" I don't mean something that can't be changed -- only something that isn't going to be budged by moralistic pronouncements about fairness. To show what I mean by structural imperative, I would like to share a composite chart that integrates the data from the EPI productivity and median income chart above and data comparing the energy intensity of GDP to the energy intensity per hour of work. I have added an inverted productivity series (black dotted line) for reasons that will become clear as the narrative unfolds.
 |
| Sources: U.S. Bureau of Labor Statistics, Energy Information Agency, U.S. Census Bureau |
The first thing that becomes clear from this chart is that productivity, median income and the energy intensity per hour worked tracked each other closely from 1949 to 1973. The latter year was chosen as the index year because energy intensity per hour of work peaked in that year. After 1973, energy intensity per hour of work declined for about ten years and then remained virtually flat up to the present. Productivity and Median Income diverge after 1973.
The inverted productivity series now presents a clue as to what exactly is being "decoupled" in all this decoupling. With productivity defined as GDP per hour worked, inverted productivity is hours worked per unit of GDP. Before 1973, inverted productivity appears as simply the mirror image of productivity, median income and energy intensity per hour worked. After 1973, though, it tracks energy intensity of GDP, while the stable energy intensity of hours worked can be understood as the axis around which productivity and energy intensity of GDP rotate and reflect one another. For all intents and purposes, then, one could say that "energy intensity of GDP" is a statistical tautology, which itself, prior to 1973, performed as the axis around which productivity growth translated into steady gains in median income.
Correlation does not imply causation. Sometimes, however, it reveals a hidden tautology. Hours, energy consumption, income and GDP are inputs and outputs of an economic system that transforms some of those into some of these. The inputs don't cause the outputs any more that cattle "cause" beef, they're just different names for the same thing in a different state.
The indexes I have plotted in the graph are ratios between inputs and outputs (productivity and energy intensity of GDP) or inputs and other inputs (hours of work and energy consumption). Median family income can be thought of as a circular ratio of inputs and outputs in which both income and the family can be viewed alternatively as either outputs or inputs -- income provides sustenance for the family; the family supplies labor to industry in return for income and so on.
Ratios between inputs do not wholly determine ratios between outputs or between inputs and outputs. Policies do that. But the quantities of outputs are constrained by the quantities of inputs. It is thus necessary when examining the energy intensity of GDP, for example, to ask what is happening with the other inputs and the other outputs.
In closing, I would like to present a third chart that compares the growth of population, labor force, employment and hours worked in the U.S. from 1950 to 2009.
When I initially chose employment as the numerator of an alternative index, I was aware that there was a rough coincidence with total population and thus would be similar to a per capita energy consumption index but would smooth out some of the cyclical variations. Aggregate hours of work presumably performs this smoothing function even more precisely. For the last fifty years, though, the growth in employment, labor force and aggregate hours has been steeper than population growth, with hours reaching a peak in 2000 of nearly 30% more per capita than in 1961. Employment as a percentage of total population peaked in 2008, even though labor force participation peaked in 2000 because the later ratio considers only the population 16 years and older.


No comments:
Post a Comment