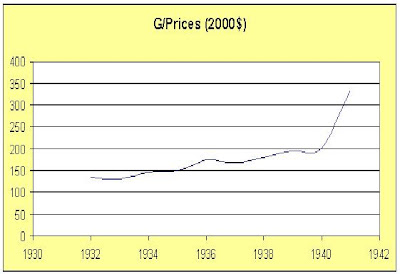

Let’s return to the discussion of New Deal economics, that is the role of fiscal policy during the first two FDR administrations and look at the discussion from Alex Tabarrok:
Thus, an accurate portrayal of fiscal policy during the Great Depression - entirely consistent with Krugman - is that we had much greater spending, much greater taxes and not much economic stimulus.
Raising tax rates during a period when aggregate demand falls far short of potential GDP does seem silly but I have to challenge this notion that we tried a massive increase in government purchases. Using BEA data, I have provided graphs of real government purchases (G/Prices in terms of 2000$) and the ratio of government purchases to GDP (G/GDP). Before 1941, the increase in government purchases roughly mirrored the increase in GDP so this claim of “much greater spending” sounds a bit suspicious. Of course, government purchases did increase substantially starting in 1941 but then as the graph of output to potential output provided by Paul Krugman notes – that is when fiscal stimulus did restore full employment.
Update: Marginal Revolution reader Marmico challenges the notion that tax collections rose substantially during FDR’s first two terms providing us with this link. As Marmico notes:
Conflating high individual marginal tax rates with much greater taxes is bunk.
To be fair, Marmico’s graph shows only a subset of Federal tax revenues as a share of GDP so I have added a graph of total government revenue (Rev) relative to GDP.


7 comments:
Here from HSUS is Federal Spending by year - note by 1934 spending had more than doubled in nominal terms.
Year Fed Spending
1928 2,961,245
1929 3,127,199
1930 3,320,211
1931 3,577,434
1932 4,659,182
1933 4,598,496
1934 6,644,602
1935 6,497,008
1936 8,421,608
1937 7,733,033
1938 6,764,628
1939 8,841,224
Here is real spending which takes into account the fact that prices were falling. The increase is even more striking.
Year Real Spending
1928 2,961,245
1929 3,127,199
1930 3,399,737
1931 4,024,613
1932 5,815,475
1933 6,048,791
1934 8,479,306
1935 8,109,404
1936 10,360,395
1937 9,182,977
1938 8,203,911
1939 10,876,614
Data here
http://hsus.cambridge.org/HSUSWeb/toc/tableToc.do?id=Ea584-587
Note that this not controversial, everyone on left and right agrees spending increased a lot.
Alex - given that the difference between spending and purchases is transfer payments, it seems safe to say that transfers increased during the 1930's. Marmico was challenging the presumption that taxes rose substantially. While his graph was less than complete, my graph (in the update) shows total government revenues per BEA.
Looking over more of the BEA data v. what Alex presents in his comment, four observations:
(1) The movement in total transfer payments isn't really that large
(2) There is some noise in government investment spending during the period
(3) Alex is starting with 1929 and I'm starting with the end of Hoover
s Administration (given Paul's focus was on the New Deal) and yes total FEDERAL spending rose under Hoover (go figure)
(4) But finally - state and local spending did not rise under Hoover, which begs the question - why is Alex focused on Federal spending and not total government spending in his comment?
We could (maybe should) present total government spending (in honor of Marmico's comment, we did present total revenue) as shares of GDP during FDR's 1st two terms but I don't think that would radically change the point. To say this was some massive experiment in increasing both G and T (ala the balanced budget multiplier perhaps) doesn't square with at least my read of the data.
The issue is that Tabarrok conflated raising marginal tax rates (which Hoover did incidentally)from a Carpe Diem chart (which Mankiw has now blogged) with much greater taxes.
Smoot-Hawley raised federal government revenues as a percentage of GDP, not individual or corporate tax receipts.
From the same source, total federal + state government revenues as a percent of GDP are here.
Another dataset for perspective. Total federal government spending as a percentage of GDP HERE. The raw data is relatively meaningless.
Please note that the deficit as a percentage of GDP was higher in 1983 than in 1934. The 2009 deficit will smoke both and we will be back to the Truman era with the debt/GDP ratio.
Depression,Cold War,Systemic Derivative Meltdown; government profligacy knows no bounds.
Marmico - thanks for reminding us that the Economic Report of the President has this dataset showing Federal expenditures and revenues as a percent of GDP. I guess Alex would note the increase (from a low percentage) in expenditures up to 1932 while I would note the relatively flat level for the FDR period before 1941. As I noted earlier, Alex's series like this one focused on Federal spending not total government spending.
Looking at total government spending or revenue as a percentage of GDP seems to be rather silly. There is a somewhat direct correlation between government spending and GDP -- As government spends the GDP rises. Using one to measure the other doesn't really tell you much. This is also true when speaking of taxation and not actually talking about _WHAT_ is being taxed. When the proceeds of a tax on economic rent are used to increase actual capital development and wages then the economic result is a prosperous economy. If you tax wages below $100k and use the money for foreign military adventures then prosperity suffers.
Tax increases in the 30's were tax increases on economic rent. Government did not spend ENOUGH on transfer payments and infrastructure. The "NEW DEAL" was simply insufficient.
Post a Comment